Research

The corona, and the wind it becomes

I study the solar corona: the Sun's million-degree outer atmosphere, and the wind it launches across the solar system. Most of my work comes back to three questions. Why is the corona so hot? How does energy move through it? And how do we see it clearly enough to find out? I work at NWRA in Boulder, often with Steve Cranmer and with the PUNCH and DKIST teams.

All publications

Seeing the faint corona

A bright ball in a dark void?

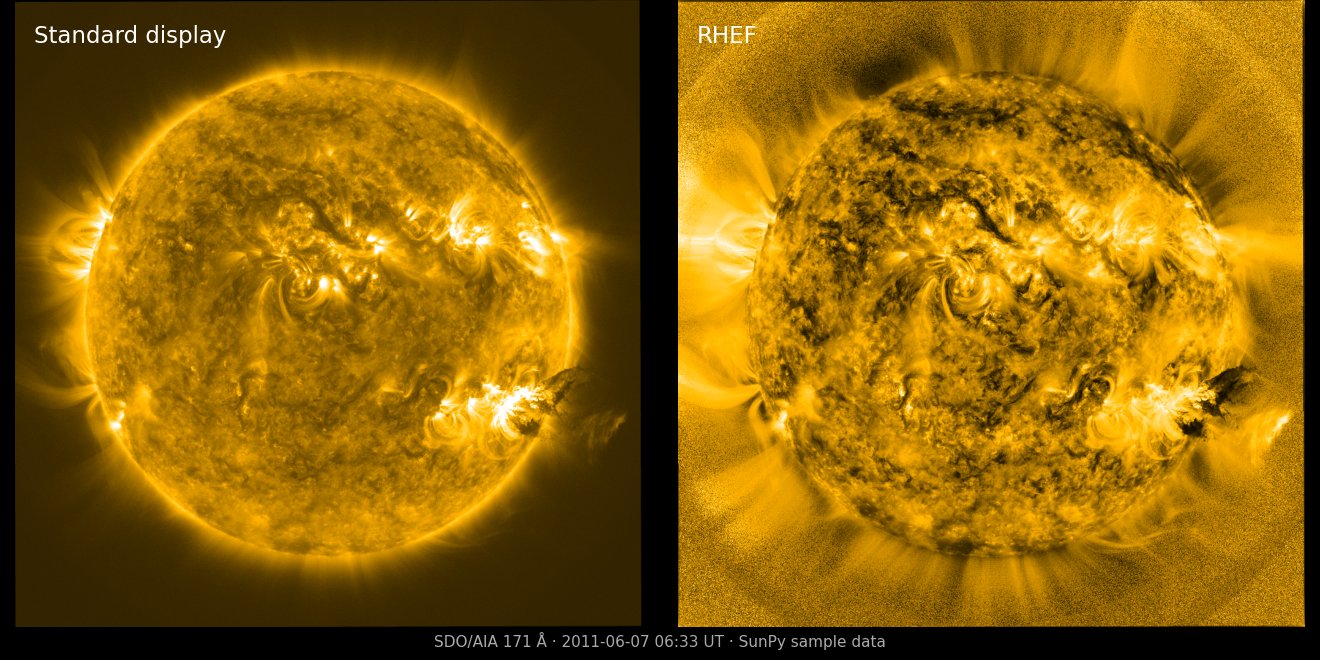
Most pictures of the Sun make it look like a bright ball in a dark void. That is basically a display problem: the corona fades steeply with height, and no single brightness scale can show all of it at once. We built the Radial Histogram Equalizing Filter (RHEF) to fix that. It combines radial graded filtering with histogram equalization, works on each frame independently with no tuning, and treats the disk and the off-limb corona alike.

Gilly & Cranmer (2025), Solar Physics · paper · get RHEF

The same SDO/AIA 171 Å image twice: a standard display on the left, and on the right RHEF revealing loops and streamers out to the edge of the frame.
SDO/AIA 171 Å, standard display (left) and RHEF at its defaults (right). SunPy sample data.

Coronal heating

Why is the corona so hot?

The corona is hundreds of times hotter than the surface below it, and after nearly a century there are still dozens of competing explanations. To test them against one another, we build three-dimensional forward models: magnetic field extrapolations filled with plasma along each loop, heated by a recipe that can mimic wave dissipation, reconnection, nanoflares or turbulence, then rendered as the intensities SDO and Hinode would actually record.

Letting that recipe vary freely, only a narrow range of parameters matched more than 500 independently measured intensities at solar minimum and maximum. Those values are consistent with imbalanced MHD turbulence, although that does not rule out other heating processes.

Cranmer & Gilly (2026), The Astrophysical Journal · paper

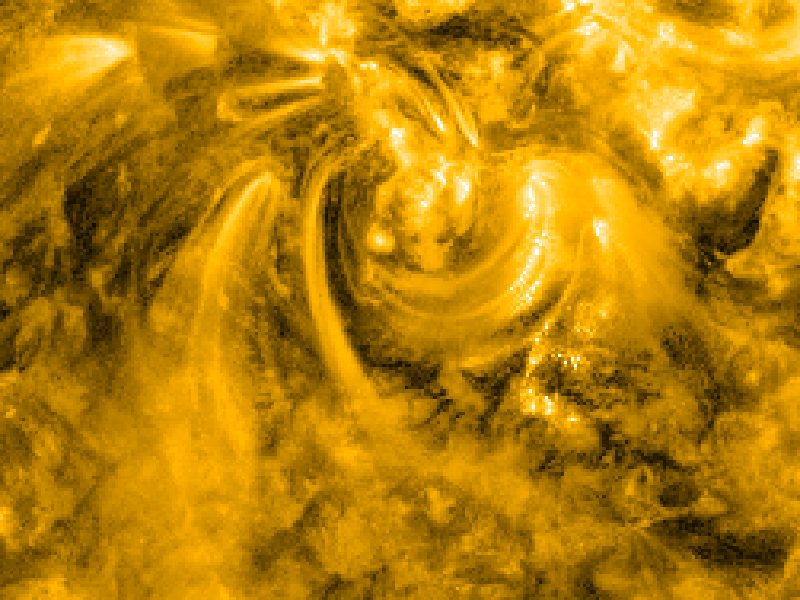
Bright coronal loops arching over an active region, in golden SDO/AIA 171 Å light.
Active-region loops in SDO/AIA 171 Å, the structures the models have to reproduce. Displayed with RHEF; SunPy sample data.

PUNCH

Where does the corona become the wind?

PUNCH, the Polarimeter to Unify the Corona and Heliosphere, images the region where the corona turns into the solar wind. One of its targets is the so-called Alfvén surface: the distance beyond which the outflowing wind outruns the waves that could carry news back down to the Sun. Our review finds that it mostly sits between about 10 and 20 solar radii, and that it is turbulent enough to be better thought of as an “Alfvén zone” than a single surface.

I also build the tools to model and look at PUNCH data, from STRIA, a module for forward-modeling PUNCH observations within FORWARD, to HelioFITS Studio.

Cranmer, Chhiber, Gilly et al. (2023), Solar Physics · paper

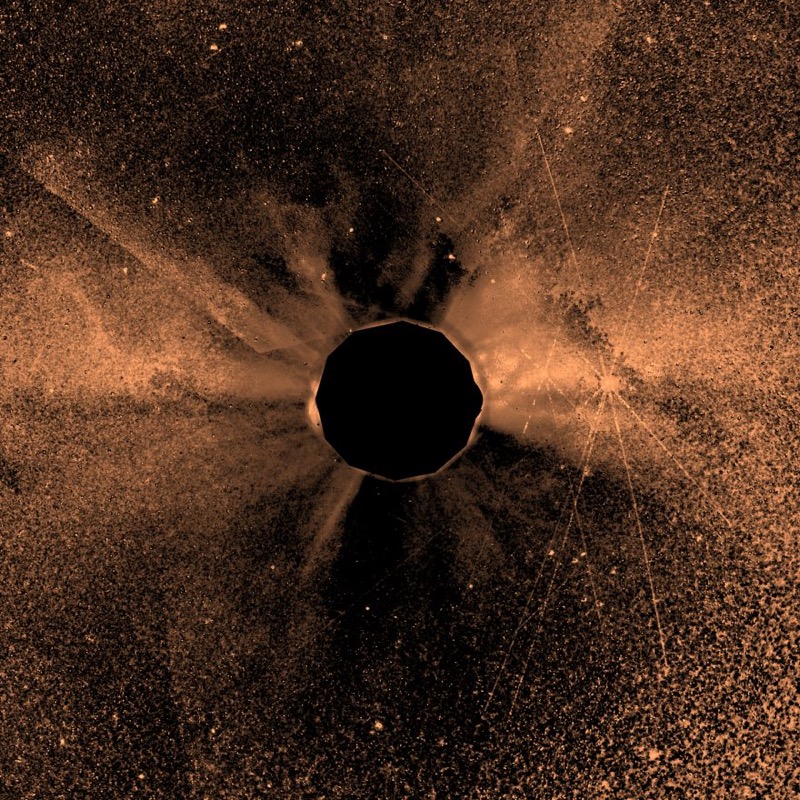
PUNCH wide-field mosaic of the outer corona: bright streamers radiating from a black central mask.
PUNCH Level 3 CAM mosaic, 2026-08-17 23:44 UT, displayed with RHEF. The black disk is masked; there is no data inside the inner edge of the field of view.

Coronal waves with DKIST

Waves, a second at a time

The corona is full of waves, and some of them may carry the energy that heats it and drives the solar wind. Cryo-NIRSP on the 4-meter DKIST can watch the off-limb corona in the Fe XIII 1074 and 1079 nm lines faster than once per second. Led by Momchil Molnar, we found enhanced wave power up to 100 mHz in active-region loops, spectroscopic evidence for MHD waves with 30–100 s periods that change with height, and a significant anticorrelation between line intensity and line width.

Molnar, Morton, Paraschiv, Gilly, Cranmer et al. (2026), ApJ · paper

Solar wind modeling

Field lines as strings

Global solar wind models tend to come in two flavors: fast heuristic ones built on potential-field extrapolation, and full 3D MHD simulations that are rigorous but expensive. FLUX, the Field Line Universal relaXer, sits in between. It treats the magnetic field as a set of discrete field lines, sort of like a bundle of strings, relaxes them to force balance, and then solves for a 1D solar wind along each one.

Lowder, Gilly & DeForest (2024), ApJ · paper

Tools from this work

Earlier work

Where it started: GHOSTS

My first paper built GHOSTS, a forward model of how line-of-sight effects shape coronal spectral lines just above the limb. In essence, as temperature changes the ion populations with height, the light we collect can come mostly from foreground and background plasma rather than the plane of the sky. A line width can then stay flat with height even while the temperature climbs quickly, and its nonthermal part can greatly exceed the local solar wind speed. Gilly & Cranmer (2020), ApJ · arXiv · PDF. The full story is in my PhD thesis (also on ProQuest).

An overview talk to the PUNCH team · Earlier research projects